> ## Documentation Index
> Fetch the complete documentation index at: https://docs.maximus.trade/llms.txt
> Use this file to discover all available pages before exploring further.
# Auto-Charting
> Key levels and chart tools drawn automatically. No manual setup.
## What it does
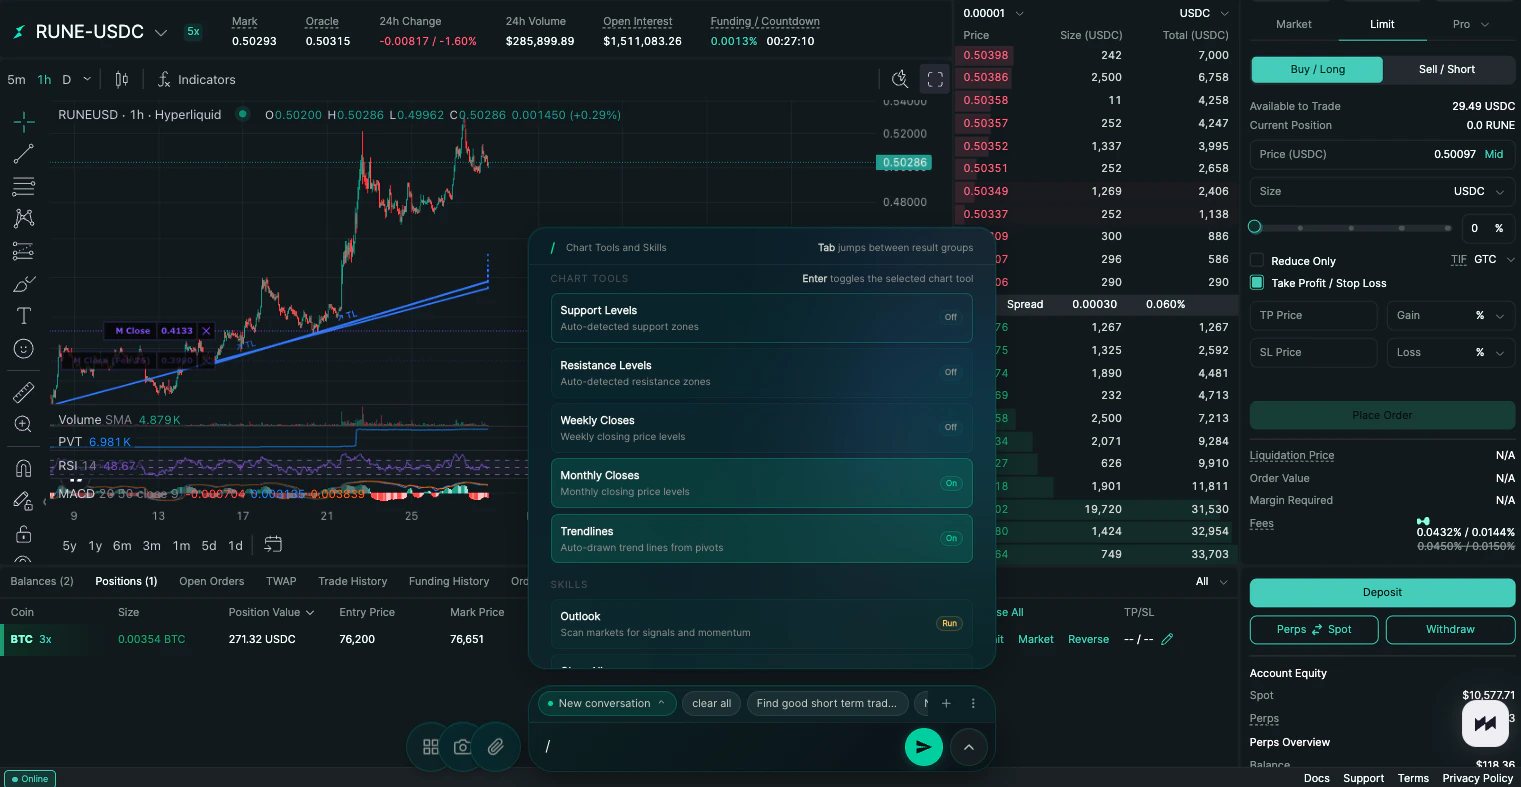
Maximus draws technical levels directly on your HyperLiquid chart. Support zones, resistance zones, trendlines, monthly closes, weekly closes. All toggled on with a single keystroke. You focus on the trade, not the setup.
## How to use it
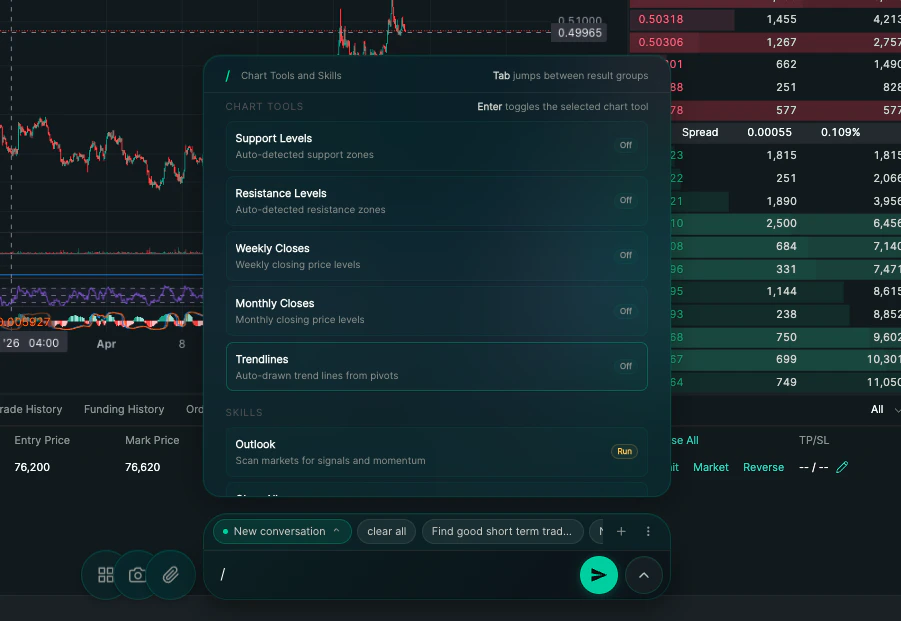
Type `/` in the prompt bar to open the chart tools and skills menu. Use Tab to jump between groups and Enter to toggle a tool on or off. You can also click directly on any tool to toggle it.
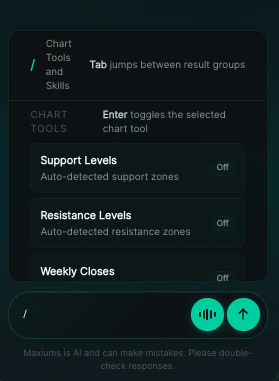 The same menu is available via the Magic Bar. Press ⌘ Shift K, then type `/`.
 ## Available chart tools
Each tool below is an individual toggle. Turn on as many or as few as you need.
| Tool | What it draws |
| ----------------- | ---------------------------------- |
| Support Levels | Auto-detected support zones |
| Resistance Levels | Auto-detected resistance zones |
| Weekly Closes | Weekly closing price levels |
| Monthly Closes | Monthly closing price levels |
| Trendlines | Auto-drawn trend lines from pivots |
This list grows as new tools are added. Type `/` to always see the latest.
## Available chart tools
Each tool below is an individual toggle. Turn on as many or as few as you need.
| Tool | What it draws |
| ----------------- | ---------------------------------- |
| Support Levels | Auto-detected support zones |
| Resistance Levels | Auto-detected resistance zones |
| Weekly Closes | Weekly closing price levels |
| Monthly Closes | Monthly closing price levels |
| Trendlines | Auto-drawn trend lines from pivots |
This list grows as new tools are added. Type `/` to always see the latest.
 ## Skills
Below the chart tools you'll find one-time run commands:
| Skill | What it does |
| --------- | ---------------------------------------------- |
| Outlook | Scans markets for signals and momentum |
| Show All | Activates all chart tools at once |
| Clear All | Removes all overlays and shapes from the chart |
| Help | Shows all available commands |
To clear everything off your chart at any time, run the **Clear All** skill or type `/clear` in the prompt bar.
## Skills
Below the chart tools you'll find one-time run commands:
| Skill | What it does |
| --------- | ---------------------------------------------- |
| Outlook | Scans markets for signals and momentum |
| Show All | Activates all chart tools at once |
| Clear All | Removes all overlays and shapes from the chart |
| Help | Shows all available commands |
To clear everything off your chart at any time, run the **Clear All** skill or type `/clear` in the prompt bar.