What it does
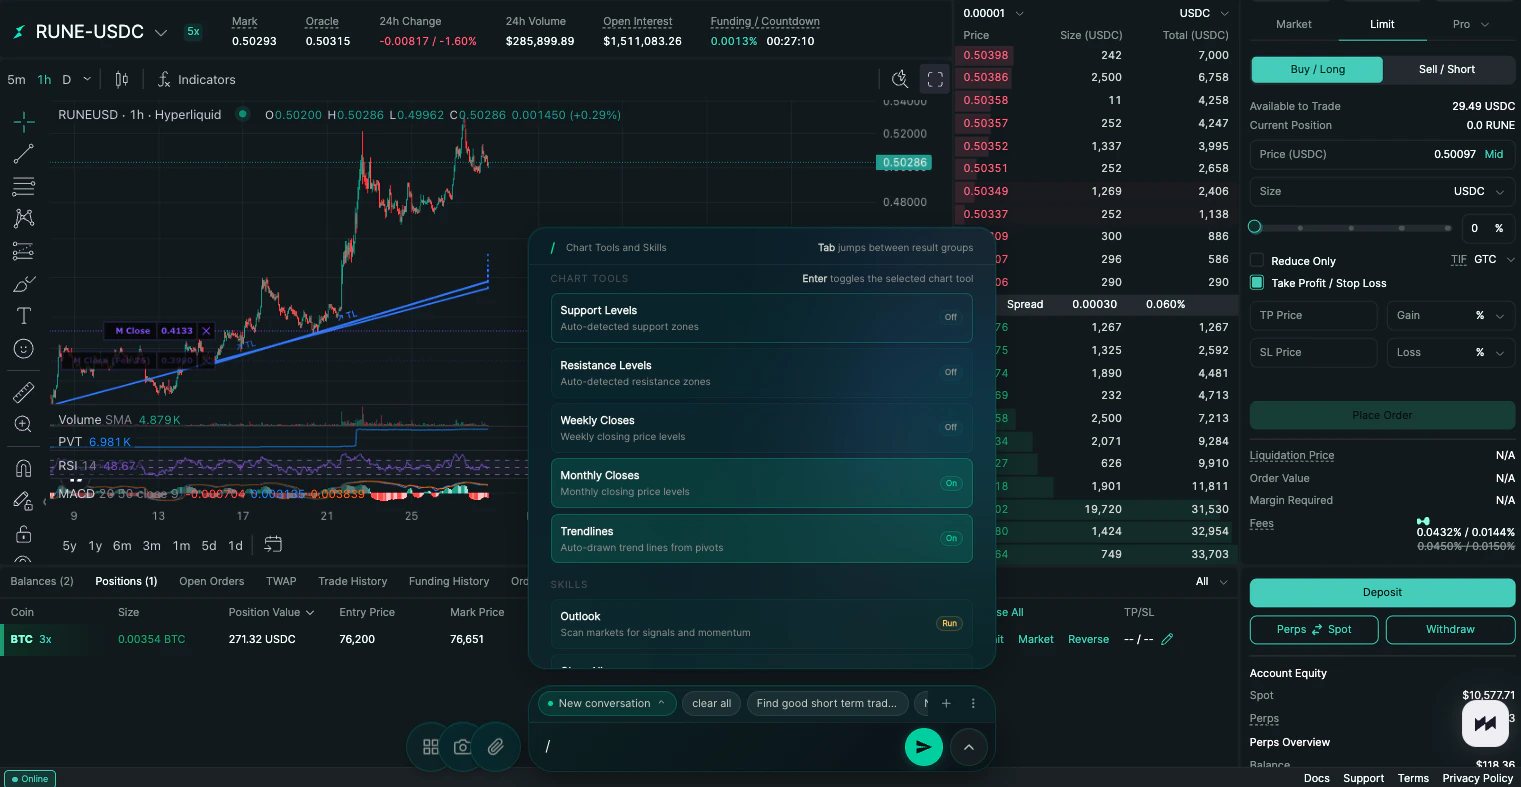
Maximus draws technical levels directly on your HyperLiquid chart. Support zones, resistance zones, trendlines, monthly closes, weekly closes. All toggled on with a single keystroke. You focus on the trade, not the setup.How to use it
Type/ in the prompt bar to open the chart tools and skills menu. Use Tab to jump between groups and Enter to toggle a tool on or off. You can also click directly on any tool to toggle it.
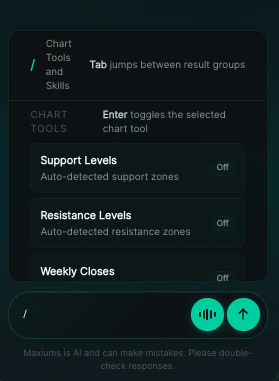
/.
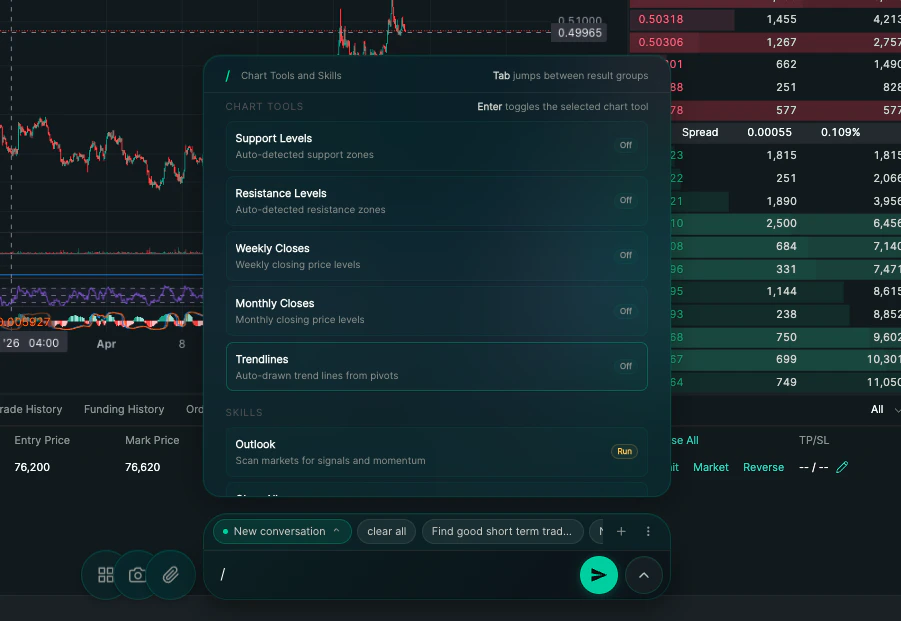
Available chart tools
Each tool below is an individual toggle. Turn on as many or as few as you need.
This list grows as new tools are added. Type
/ to always see the latest.
Skills
Below the chart tools you’ll find one-time run commands:
To clear everything off your chart at any time, run the Clear All skill or type
/clear in the prompt bar.